

Football fans always argued about luck. Was that a deserved win or a fluky one? Did the striker underperform or simply face no decent chances? For decades those debates had no referee. Then xG arrived, and the argument finally had numbers.
What xG Actually Is
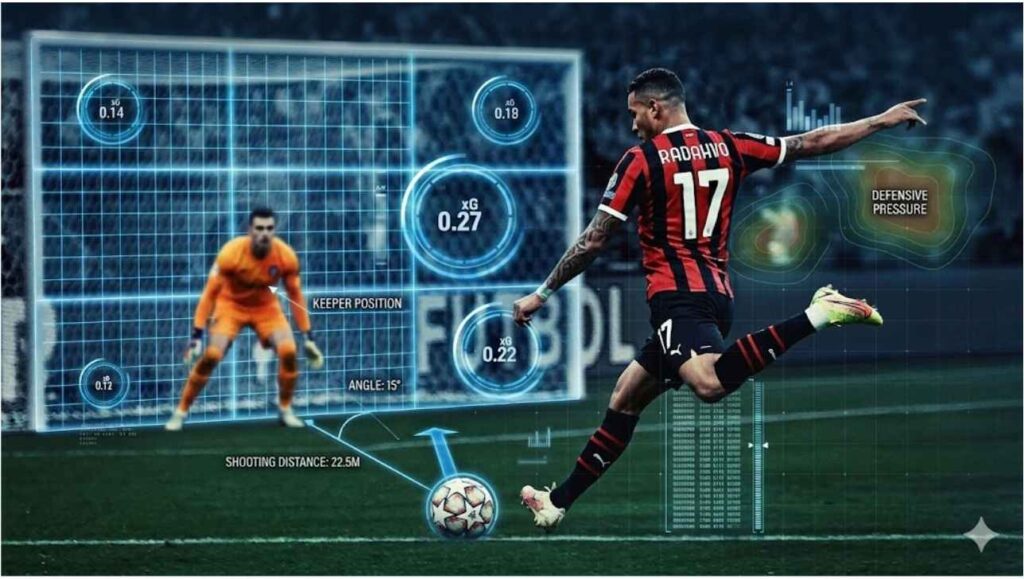
Expected goals, shortened to xG, assigns a probability to every shot in a match. A shot from six yards out, central, with the goalkeeper off his line might carry an xG of 0.85. That same position from a tight angle, under pressure, drops to maybe 0.2. The stat emerged in 2012, developed by Sam Green at Opta, built on historical data from nearly one million shots. One million shots just to produce a decimal. That should give a sense of how much is baked into what looks like a simple number.
The model considers distance, angle, goalkeeper position, whether the shot was a header, and the pattern of play that created the chance. Penalties sit at 0.79 xG because 79% of penalties historically result in goals. Fans who engage with probability in other competitive contexts, like followers of best aviator sites in Kenya who track odds and risk across rounds, find the underlying logic immediately familiar.
The point of summing shot values across a full match is to answer one basic question: who deserved to win? A team that scores twice but generated only 0.6 xG probably got lucky. A team that lost 1-0 but produced 2.8 xG probably played better than the result shows.
How It Went from Spreadsheet to Saturday Night Television
xG stayed with analysts and betting companies for years. Football clubs adopted it quietly, using it to assess whether a striker’s drought reflected bad finishing or simply a lack of chances. Then in August 2017, BBC’s Match of the Day added xG graphics to its standard post-match breakdown.
The backlash tells you something. Jeff Stelling declared on air that xG was “the most useless stat in the history of football.” His argument: the game has already finished, so what does this number add? It is a fair question. For those who want football to stay in the realm of what happened, xG feels like an attempt to dispute the result. For those who want to understand why results happen, it feels essential.
Arsène Wenger became one of the first high-profile managers to publicly embrace it. After Arsenal lost 3-1 to Manchester City in November 2017, he noted the xG had been 0.7 for City and 0.6 for Arsenal, arguing the match had been tight despite the scoreline. Stelling, watching this on Soccer Saturday, reportedly could not believe a manager had quoted expected goals on camera.
Things that surprised people when xG went public:
- Wenger cited it in a post-match presser before most fans had heard the term
- Match of the Day added the graphic without explanation, assuming viewers would absorb it
- Twitter responded within minutes with complaints about “nerd stats” ruining football
What xG Can and Cannot Tell You
The stat works best across large samples. One match tells you very little. Over ten matches, over a season, expected goals reveals genuine patterns. A striker whose goal tally sits well below his xG is either unlucky or wasteful. A goalkeeper whose goals conceded far exceed his team’s xGA may be struggling more than the clean sheets suggest.
What xG cannot do is account for individual brilliance. A 35-yard volley that flies into the top corner carries an xG of perhaps 0.03. The model has nothing meaningful to say about it except that the universe misbehaved. That is not a flaw. That is exactly what the model is designed to flag.
Common misconceptions about xG:
- That a high xG means a team should have won (it means they created better chances, not a guaranteed result)
- That it ignores context (modern models account for defensive pressure and game state)
- That one good match proves the stat wrong (sample size matters more than any single game)
The useful version of the debate is not expected goals versus the eye test. Both carry information. A manager who watches 90 minutes and notes his striker looked hesitant in front of goal sees something xG cannot capture. A scout checking xG against actual goals over 30 matches sees something the eye alone misses. The two reinforce each other, when people let them.
What has genuinely changed since 2017 is the audience. Expected goals now appears on Premier League broadcasts, in fan forums, in transfer discussions. A striker described as “underperforming his xG” is recognisable shorthand for wasting good chances. That shift from spreadsheet to common parlance took just over a decade.
Read More: